


![]()
![]()
CDA 2011 Advisor Disability Awareness Study
The Disability Divide: Advisor Study
The gap between consumers’ attitudes – and advisors’ perceptions of those attitudes – about disabilities and their potential threat to their financial security.
- Overview
- Highlights & Methodology
- Beliefs About Disability
- Overall Odds of Disability
- Causes of Disability

Overall Odds of Becoming Disabled
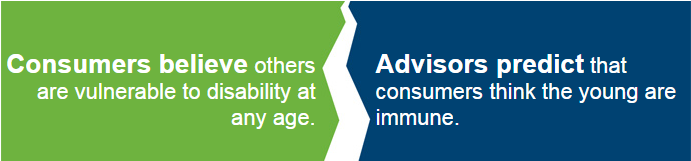
The majority of consumers don’t see age as a huge factor in determining who is most likely to become disabled.
- Over 40% (43%) of all consumers believe disability is equally likely at any age.
- 7% percent of consumers even agreed that those most vulnerable to becoming disabled are in their 20s or 30s!
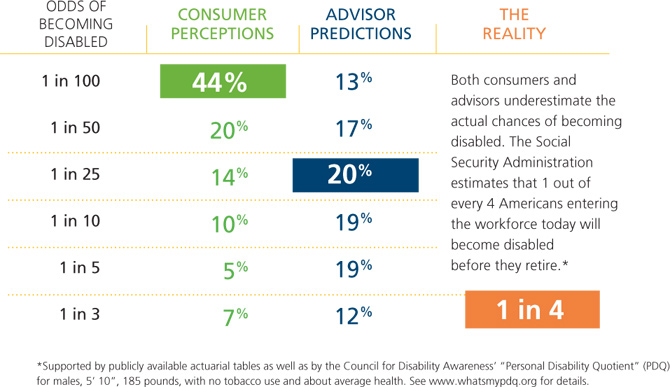
- However, when asked to estimate their own chances of becoming disabled (see chart below), many consumers viewed their personal odds as just one in 100.
- Consumers almost always believe the “other person’s” risk of disability is higher than theirs, indicating denial of the real risk of income loss.
Advisors underestimate how many consumers think disability is a risk at any age.
- Under 20% (19%) of advisors predicted consumers think “disability could happen at any age.”
- Even more advisors (41%) predicted consumers would see older people (those in their 50s, 60s or older) as most vulnerable to become disabled.
Many advisors may incorrectly assume that consumers simply don’t think people in their 20s or 30s can become disabled. This study indicates that many consumers do think disability is an “ageless” concern – even though many still don’t view it as a “personal” risk, as the chart below shows. So if advisors can find more effective ways of making this personal connection, they can find younger consumers to take steps to protect their financial security.
Charts and graphs
Research has shown that many individuals prefer to receive information graphically rather than from numbers or written text. The charts and graphs below were derived from various sources, including CDA studies. Please feel free to download and print the charts and graphs to support your needs, and help support our mission to raise awareness of the risk of disability through education and public awareness.
Infographic: The Disability Disconnect
Download our handy infographic highlighting the risk, causes and consequences of disability, and how wage earners’ perceptions differ from the reality.
Download PDF for electronic use
Download PDF for print – letter size
Download individual chart images
1. Preparing for Disability – Protect Your Income

2. Disability Divide: Worker Research Study

- Disability can happen at anytime (JPG | PDF)
- Percent who could pay the bills with no income (JPG | PDF)
- Percent who believe disability typically lasts “X” amount of time (duration) (JPG | PDF)
- What employees value (financial resources) (JPG | PDF)
- Where would the money comes from to pay bills if disabled? (JPG| PDF)
3. CDA Annual Long Term Disability Claims Review (2014)
This section last updated June 13, 2014

- Number of employers with LTD plans (View Chart)
- Number of employees with LTD coverage (View Chart)
- Number receiving disability payments (View Chart)
- Total disability payments (View Chart)
- Number of new disability claims approved (View Chart)
- Percent of disability claims by age (View Chart)
- Average age of new claimants (View Chart)
- Percentage of new claims by gender (View Chart)
- Percentage of claims by diagnosis (View Chart)
4. Social Security Disability Insurance (SSDI) Data
This section last updated June 13, 2014

- Average monthly SSDI benefit by gender (View Chart)
- Average monthly SSDI benefit by age (View Chart)
- Percent of covered workers by age – 10 year comparison (View Chart)
- Diagnostic causes of new SSDI awards (View Chart)
- Number of SSDI applications, number approved (View Chart)
- New SSDI awards as a percentage of applications (View Chart)
- SSDI historical payment data (View Chart)
- Fifteen year SSDI trends (View Chart)