


![]()
![]()
The 2007 CDA Long-Term Disability Claims Review
The Council for Disability Awareness (CDA) conducts an annual review of long-term disability claims among the U.S. working population to determine continuing or emerging trends. The 2007 CDA Long-Term Disability Claims Review includes long-term disability insurance claims data from the annual CDA member long-term disability claims survey and selected worker disability data from the Social Security Disability Insurance (SSDI) program.
Summary of Findings
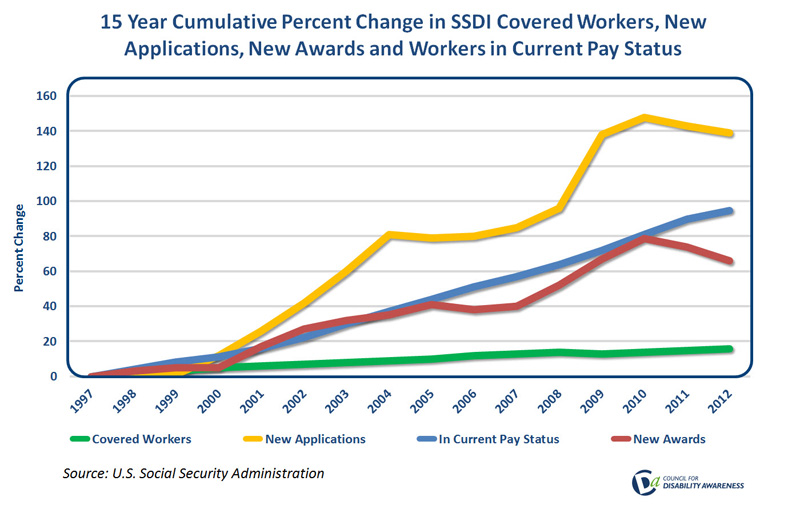
- The growth of serious disabilities among the U.S. working population continues to be alarming. Over the last 10 years, the number of U.S. workers with long-term disabilities has grown four times the increase in the number of workers in the U.S. workforce. The number of individuals receiving long-term disability insurance payments also continues to increase.
- Working women and younger employees are more vulnerable to serious disability. The growth in the rate of serious disability for working women is twice the growth rate of disabilities among working men. More younger workers in their 20s, 30s and 40s are experiencing serious disabilities.
- Favorable trends in cancer, cardiovascular/circulatory and nervous system-related long-term claims may be the result of advances in medical technology. The growth of musculoskeletal, connective tissue, mental disorder and accident/injury-related claims may be related, in some degree, to certain lifestyle choices and personal behaviors.
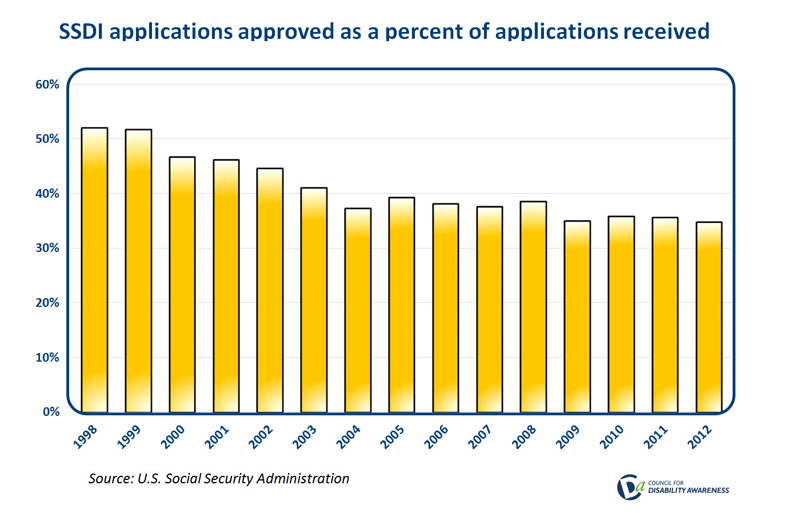
- Social Security Disability Insurance approval rates declined to 37.6% in 2007, the lowest point in the history of the program, while applications for disability payments continued to increase, reaching 2.2 million. SSDI payments have not kept pace with the growing financial needs of disabled workers, putting the financial security of more workers and their dependents at greater risk.
- Financial planning in the event of an income- limiting disability is becoming more critical and urgent for wage earners as the accountability for personal financial security continues to shift away from social programs and employers toward the individual worker.
CDA 2007 Long-Term Disability Insurance Claims Survey
Survey Highlights:
- 563,000 disabled individuals received long-term disability insurance payments from CDA member companies in 2007; this is a 4.3% increase over the number of individuals receiving insurance payments in 2006.
- $7.7 billion in long-term disability insurance claims was paid to disabled individuals by CDA member companies in 2007; this is a 7% increase over total disability claim payments made in 2006.
- 144,200 individuals were approved by CDA companies for long-term disability insurance benefits in 2007.
- $2 billion: this is the estimated total annual disability insurance payment for new claims approved in 2007.
- 95% of reported disabilities are estimated to be not work-related.
- 33% of individuals receiving long-term disability insurance do not qualify for SSDI payments.
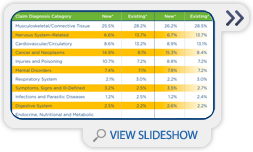
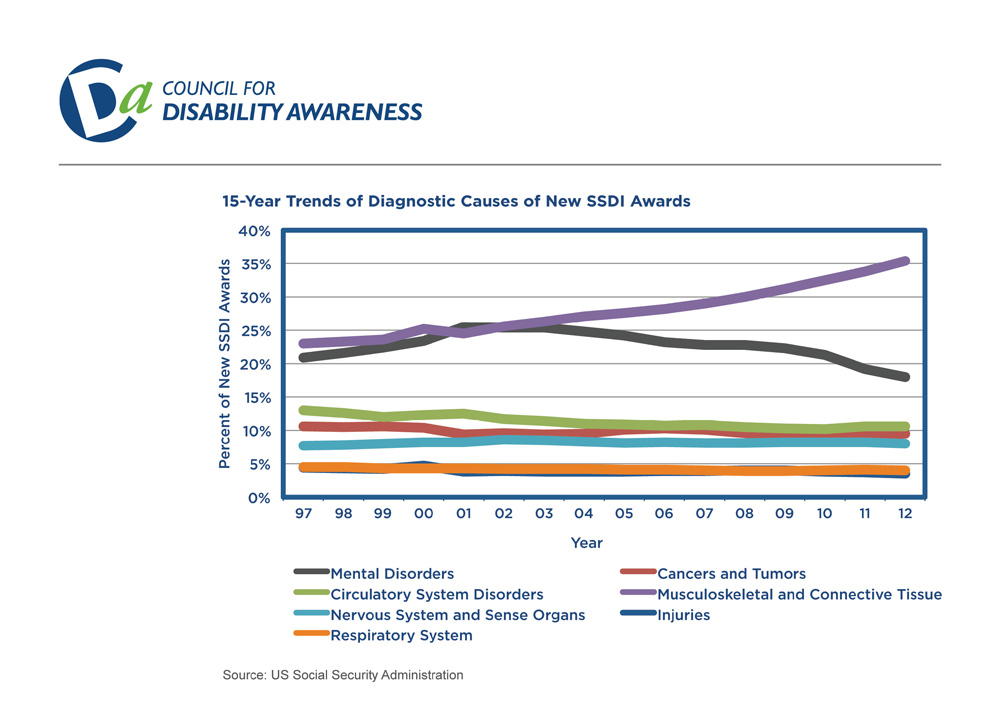
Primary Causes of Long-Term Disability Insurance Claims in 2007
- Musculoskeletal/connective tissue disorders continue to rank as the leading cause of disability.
- Cancer remains the second leading cause of new claims but is the forth leading cause of existing claims.
- Cardiovascular/circulatory problems continue to steadily decline as a cause of new and existing claims.
- Nervous system-related claims are trending down as a cause of existing claims, while mental disorder claims have been trending up.
- Injuries/accidents and maternity-related claims remain the fastest growing causes of new and existing claims.
| % of new & existing LTD claims | ||||
|---|---|---|---|---|
| Claim Diagnosis/Category | 2006 | 2007 | 2006 | 2007 |
| New | Existing | New | Existing | |
| Musculoskeletal/Connective Tissue | 22.7% | 25.7% | 22.6% | 26.2% |
| Cancer | 13.6% | 8.2% | 13.6% | 8.5% |
| Cardiovascular/Circulatory | 10.3% | 13.8% | 10.1% | 12.9% |
| Nervous System-Related | 5.7% | 11.8% | 5.8% | 11.3% |
| Injuries & Accidents | 7.8% | 5.7% | 8.1% | 6.3% |
| Maternity Related | 7.9% | 2.7% | 9.4% | 3.6% |
| Mental Disorder / Psychiatric | 6.5% | 6.6% | 6.5% | 6.7% |
| Other | 25.6% | 25.7% | 24.1% | 25.7% |
| Total LTD Claims: | 129,220 | 493,472 | 140,585 | 539,046 |
SSDI Program 2007 Annual Statistical Supplement
Highlights:
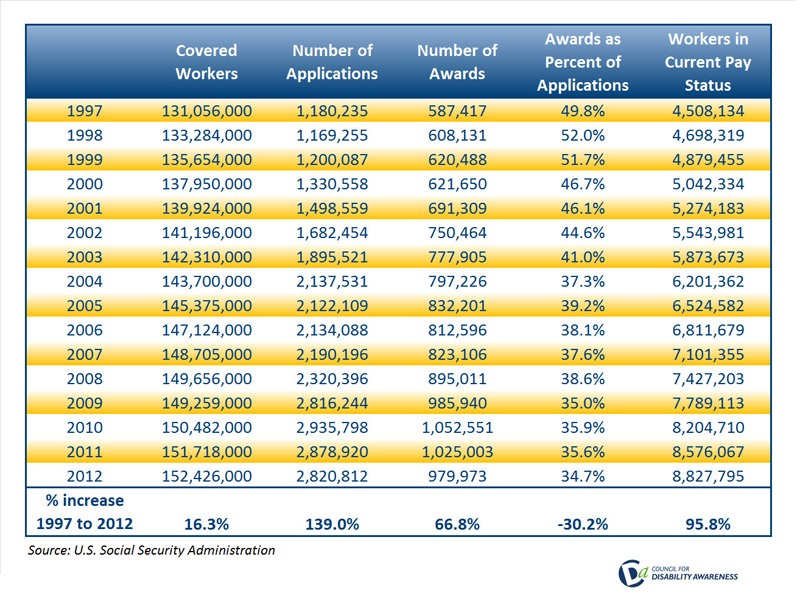
- 152 million workers were covered for disability insurance under the SSDI program in 2007; this is a 13% increase over the 134 million workers covered a decade ago.
- 7.1 million disabled workers received disability payments from SSDI in 2007; this is a 4.3% increase over 2006 and 51% more than the 4.7 million disabled workers receiving payments in 1998.
- 1.8 million disabled workers' spouses and children also received SSDI payments in 2007.
- 2.2 million workers applied for SSDI payments in 2007; this is a 2.6% more than in 2006 and 87% more than the number of workers applying for disability payments 10 years ago.
- 818,500 disabled workers were approved for SSDI payments in 2007; this is a 1.9% increase over 2006 and 35% more than the 608,100 workers approved in 1998.
Social Security Disability Insurance Applications and Approvals: 1998 - 2007
- 37.6% of workers applying for SSDI disability payments in 2007 were approved; 10 years ago the approval rate for workers applying for disability was 52%.
- $91.3 billion was paid by SSDI to all disabled workers in 2007; this is more than twice the $43.5 billion of disability payments paid in 1998.
- 70%: this is the increase in the number of disabled female workers receiving SSDI payments over the past decade, compared to a 38% increase for male workers.
- 33%: this is the increase in the rate of disability among all covered workers (the number of workers approved for disability payments compared to the total number of workers covered) over the last 10 years. Female workers' rate of disability increased 44% compared to male workers' increase of 24%.
2007 Social Security "Quick Facts"
- 51: this is the average age of a disabled worker receiving SSDI benefits.
- 2.3 million: this is the number of disabled workers in their 20s, 30s and 40s receiving SSDI benefits.
- $1,004: this is the average monthly SSDI benefit for all disabled workers; disabled male workers average $1,126 per month, disabled women average $866.
- More than 90%: this is the amount of disabled workers receiving SSDI who do not qualify for workers' compensation.
- 3 in 10: these are the chances of a young worker today becoming seriously disabled before reaching retirement.
References:
- The 2007 CDA Long-Term Disability Claims Survey
- Social Security Administration Disability Insurance Fact Sheets 2006 & 2007; www.socialsecurity.gov
- *Survey participants included MetLife, Mutual of Omaha, Hartford Life & Accident, Sun Life Financial, Lincoln Financial Group, Standard Insurance Company, Unum, Principal Financial Group, Assurant Employee Benefits, Union Central Life, MassMutual and Prudential Life. The participating CDA companies represent over 75% of the commercial disability insurance marketplace and provide long-term disability insurance coverage to 30.5 million workers, 29 million who are covered through 190,000 employer-sponsored benefit plans and 1.5 million who are insured through individually purchased disability policies.
About the Council for Disability Awareness (CDA)
The Council for Disability Awareness (CDA) is a non-profit group dedicated to helping the American workforce become aware of the growing likelihood of disability and its financial consequences. The CDA engages in communications, research and educational activities that provide information and helpful resources to wage earners, their families, the media, employers and others who are concerned about disability and the impact it can have on wage earners and their families.

Charts and graphs
Research has shown that many individuals prefer to receive information graphically rather than from numbers or written text. The charts and graphs below were derived from various sources, including CDA studies. Please feel free to download and print the charts and graphs to support your needs, and help support our mission to raise awareness of the risk of disability through education and public awareness.
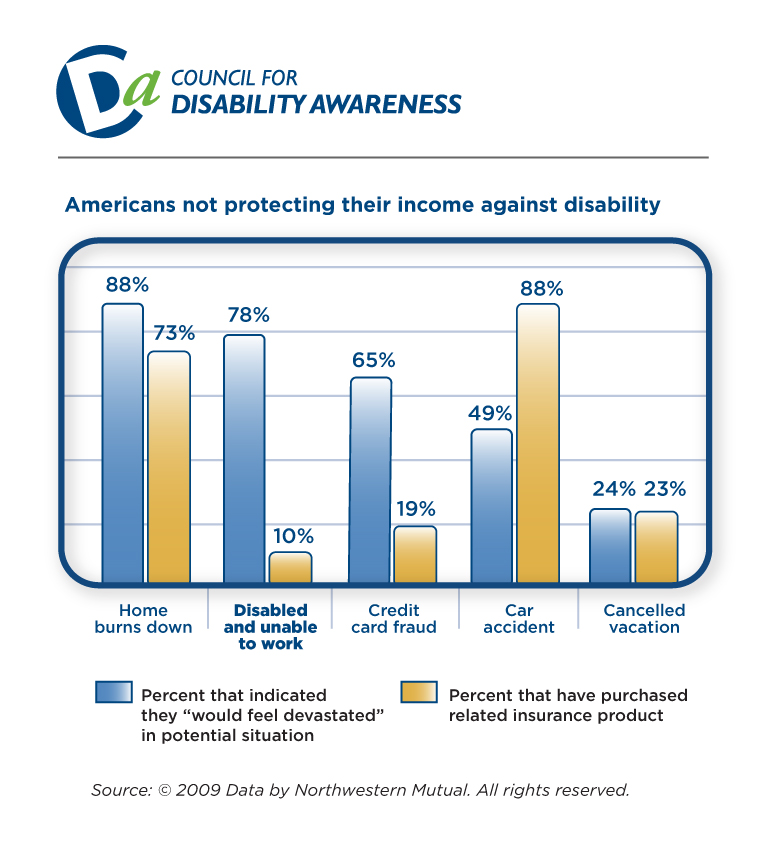
Infographic: The Disability Disconnect
Download our handy infographic highlighting the risk, causes and consequences of disability, and how wage earners' perceptions differ from the reality.
Download PDF for electronic use
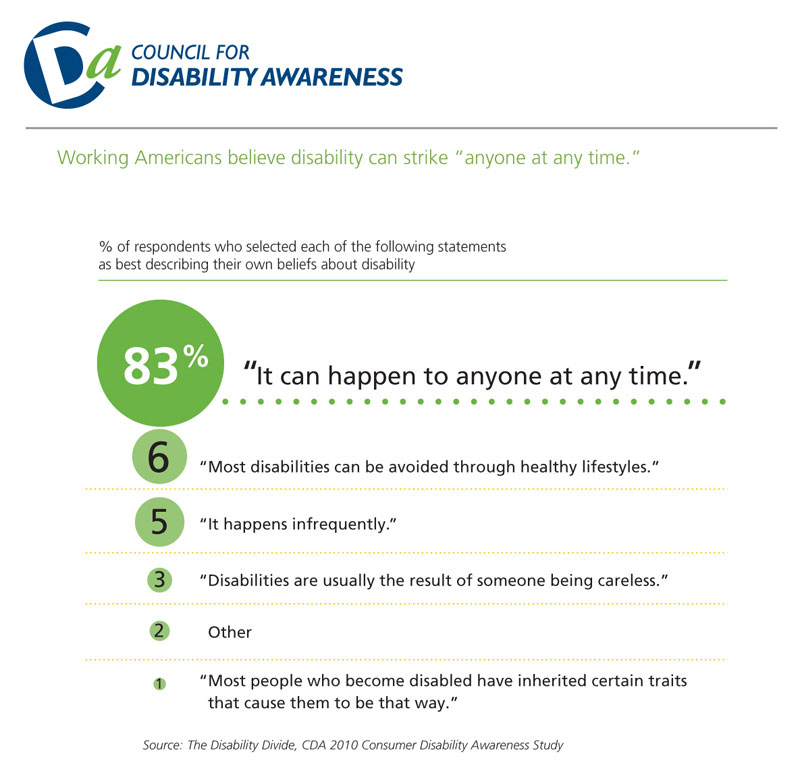
2. Disability Divide: Worker Research Study

- Disability can happen at anytime (JPG |PDF)
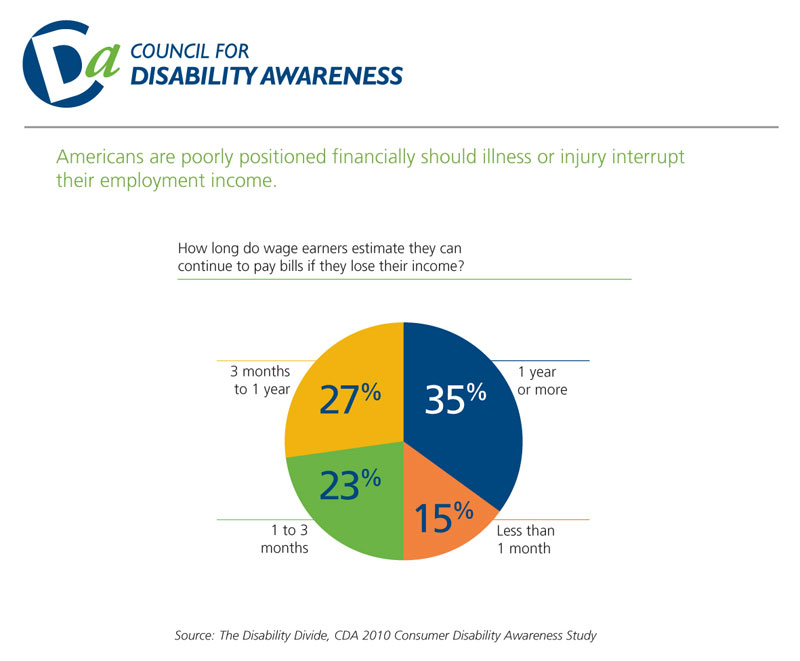
- Percent who could pay the bills with no income (JPG |PDF)
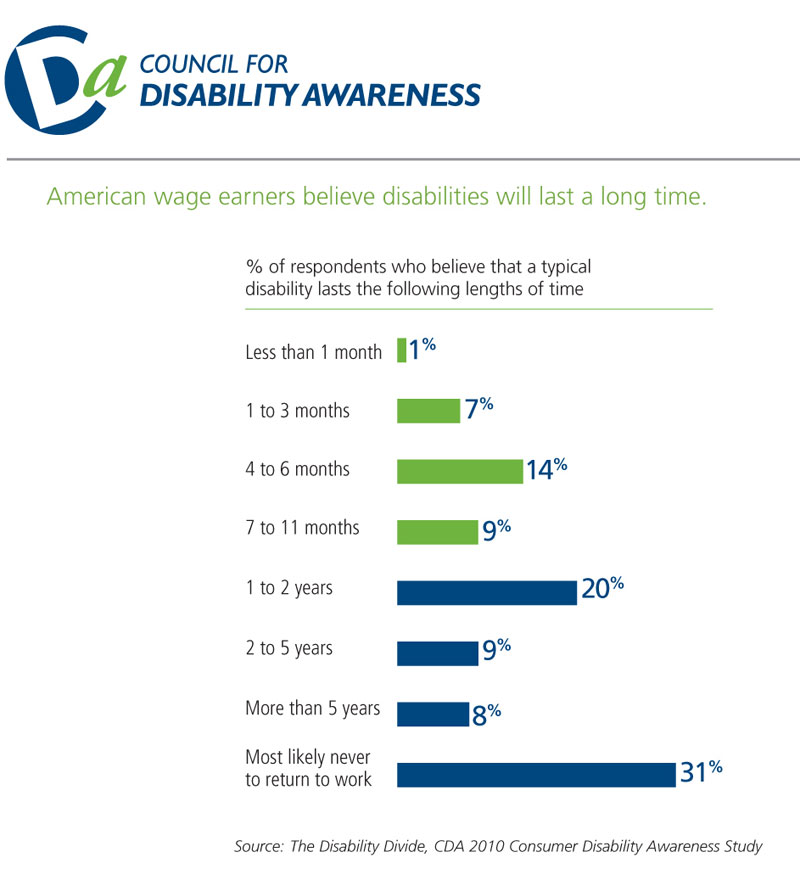
- Percent who believe disability typically lasts "X" amount of time (duration) (JPG |PDF)
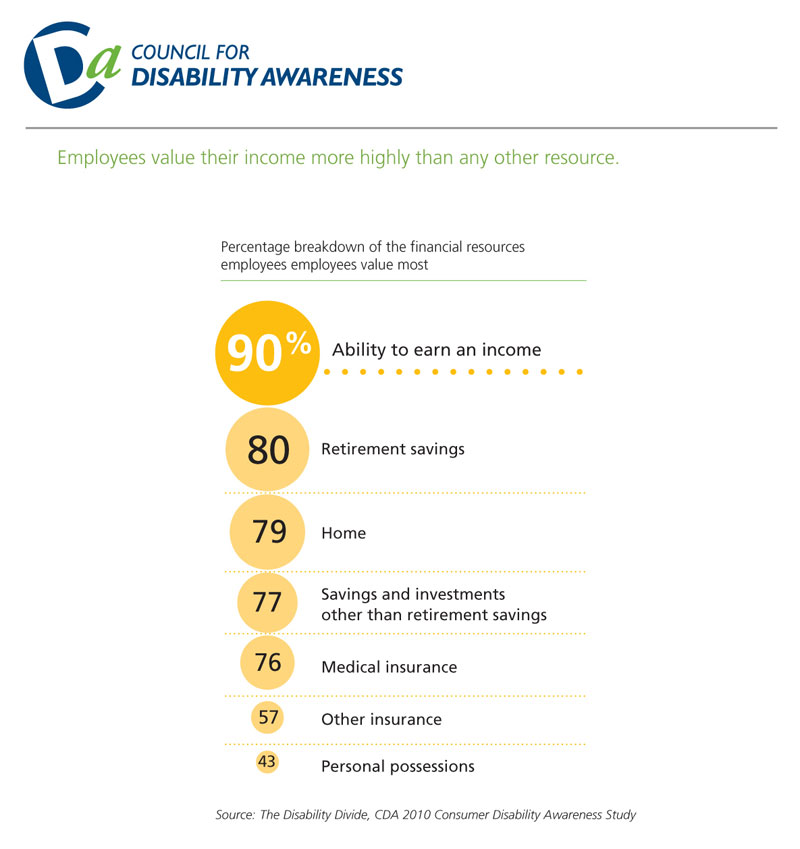
- What employees value (financial resources) (JPG |PDF)
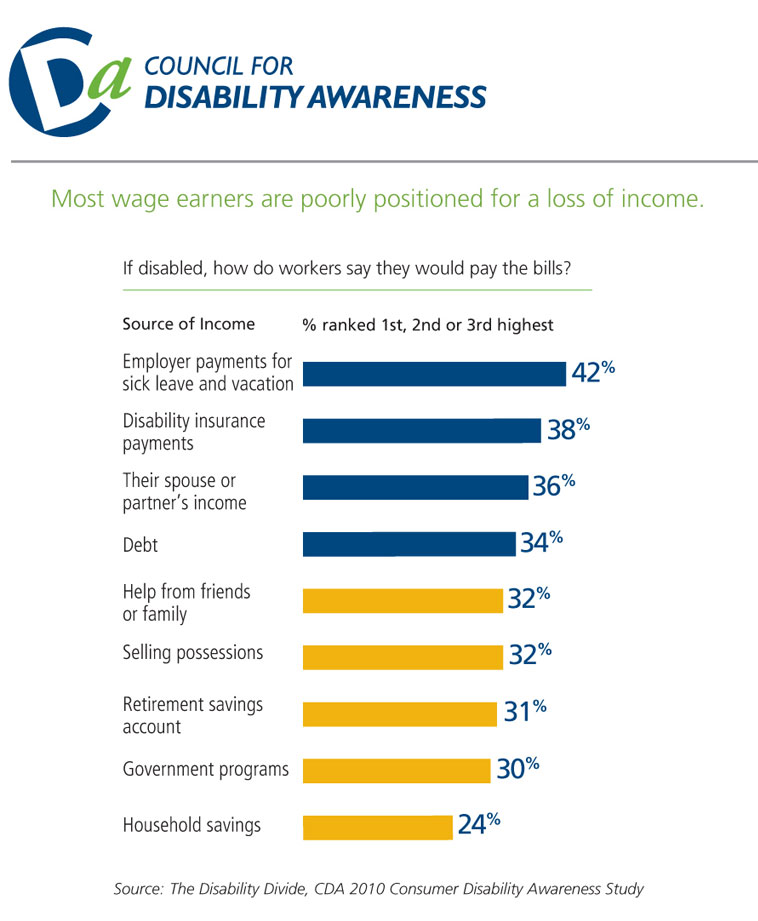
- Where would the money comes from to pay bills if disabled? (JPG |PDF)
3. CDA Annual Long Term Disability Claims Review (2014)
This section last updated June 13, 2014
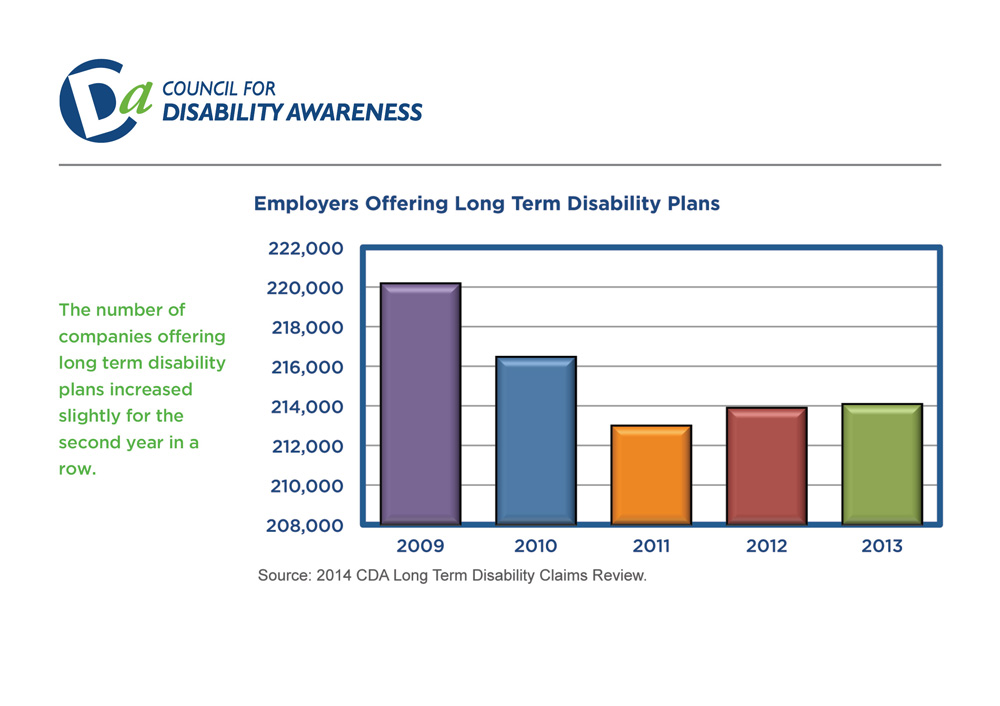
- Number of employers with LTD plans (View Chart)
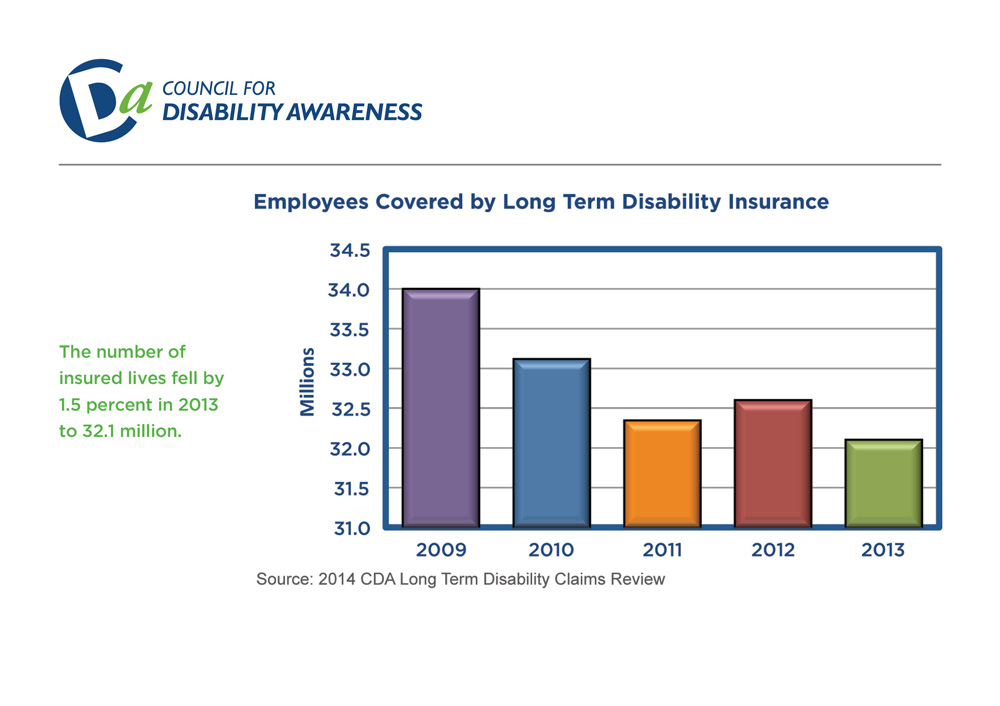
- Number of employees with LTD coverage (View Chart)
- Number receiving disability payments (View Chart)
- Total disability payments (View Chart)
- Number of new disability claims approved (View Chart)
- Percent of disability claims by age (View Chart)
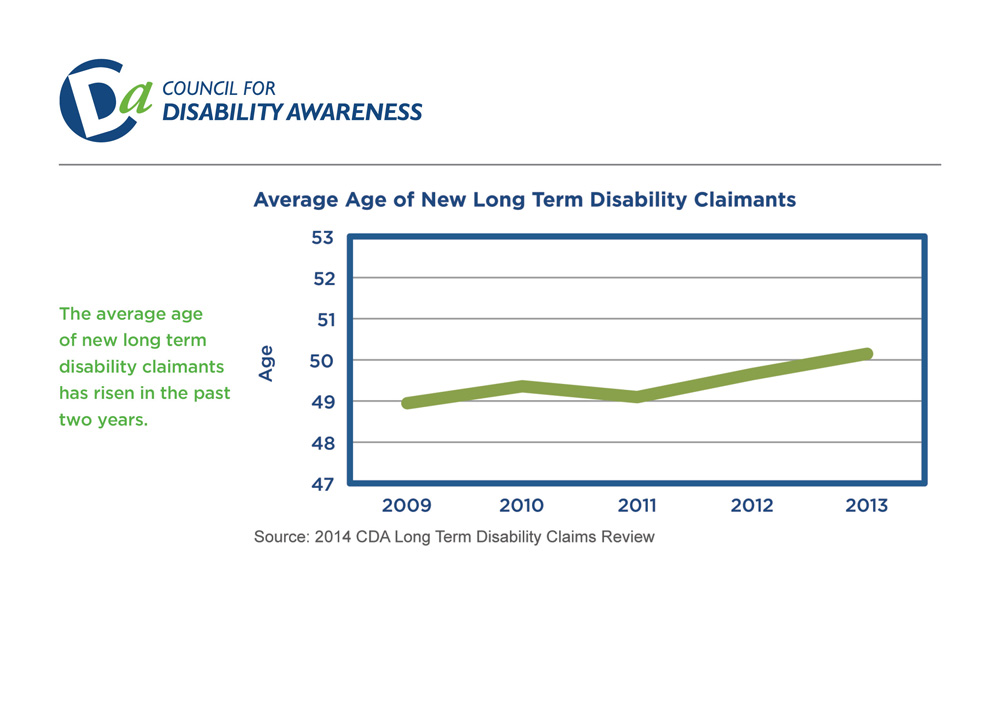
- Average age of new claimants (View Chart)
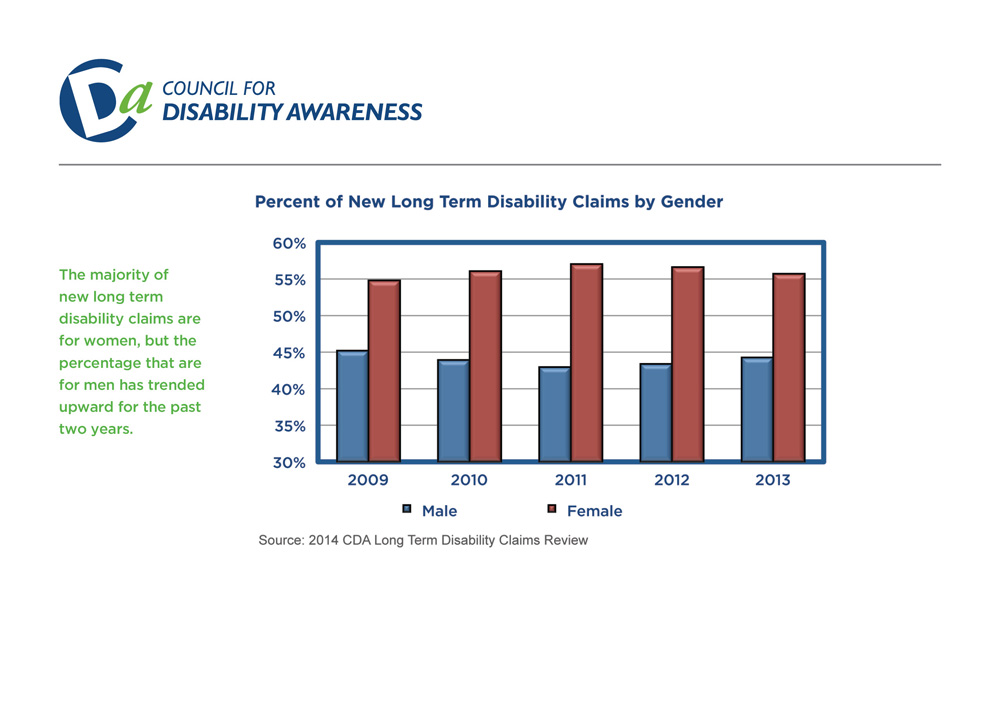
- Percentage of new claims by gender (View Chart)
- Percentage of claims by diagnosis (View Chart)
4.Social Security Disability Insurance (SSDI) Data
This section last updated June 13, 2014
- Average monthly SSDI benefit by gender (View Chart)
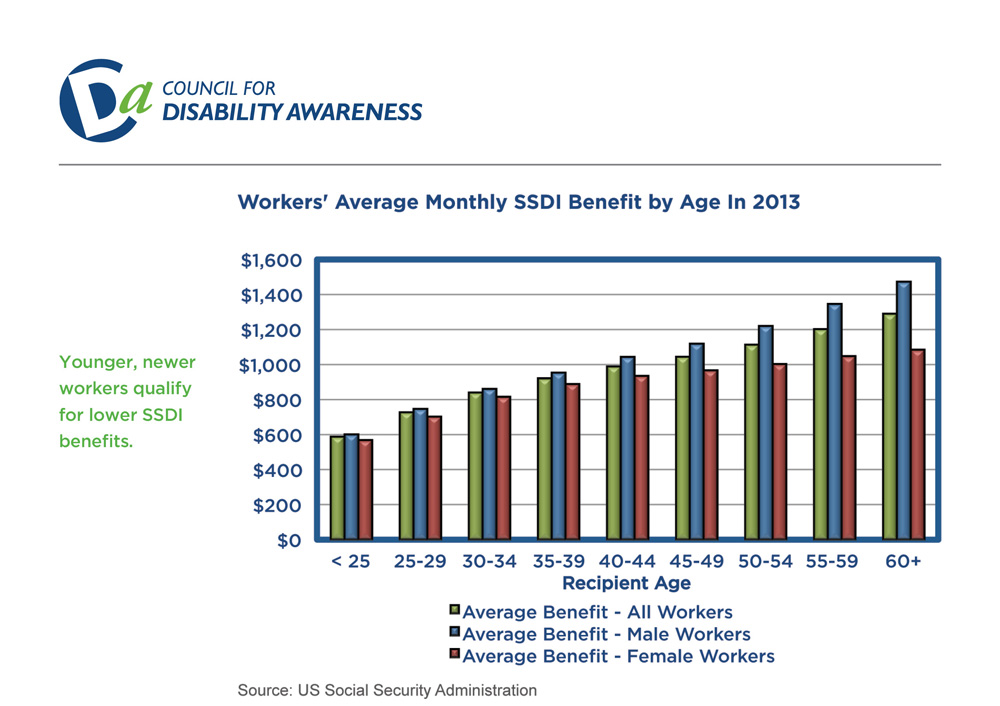
- Average monthly SSDI benefit by age (View Chart)
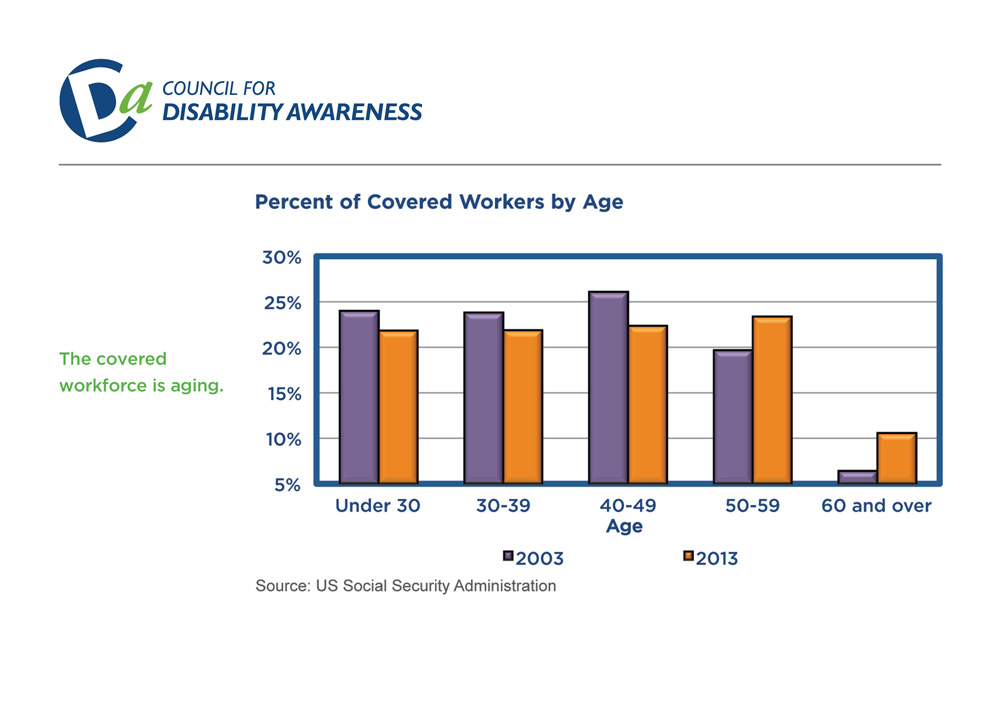
- Percent of covered workers by age – 10 year comparison (View Chart)
- Diagnostic causes of new SSDI awards (View Chart)
- Number of SSDI applications, number approved (View Chart)
- New SSDI awards as a percentage of applications (View Chart)
- SSDI historical payment data (View Chart)
- Fifteen year SSDI trends (View Chart)