
CDA 2011 Advisor Disability Awareness Study
The Disability Divide: Advisor Study
The gap between consumers’ attitudes – and advisors’ perceptions of those attitudes – about disabilities and their potential threat to their financial security.
- Overview
- Highlights & Methodology
- Beliefs About Disability
- Overall Odds of Disability
- Causes of Disability

Methodology & Highlights
Overview of survey methodology
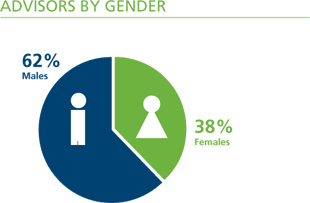
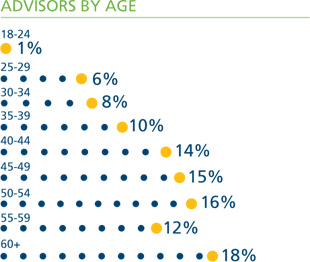
For this research study, the Council for Disability Awareness conducted an online survey of financial advisors – both individual advisors (those who work more often with consumers in one-on-one settings) and group advisors (who typically advise employers and consumers in the work setting). The results reflect the responses of 1,267 financial advisors (31% individual and 69% group) gathered during the early months of 2011.
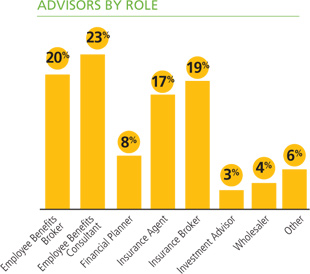
All advisors in this survey are involved in providing clients with information and advice about financial and risk protection issues. They represent different roles within the industry, as highlighted in the chart below. Advisors were offered a small incentive to participate in this study.
In this report, we’ve also summarized 2010 feedback from consumers who were recruited through a MarketTools ZoomPanel. For the purpose of this study, consumers are defined as any American wage earner. Each consumer received an incentive from MarketTools to participate in that survey.


Highlights of survey findings
The results of the 2011 Advisor Disability Awareness Survey illustrate some interesting “divides” between how consumers responded to questions related to income-threatening disabilities – and how advisors predicted they would respond to those same questions. There were also a few surprising divides between the perceptions of both groups…and the actual realities of disability. Here are just a few highlights of the key findings:
- Consumers think disabilities occur more frequently than advisors assume they do.
83% of consumers believe “a disability could happen to anyone at any time”; only 35% of advisors thought consumers would agree with this statement. - Both consumers and advisors underestimate the true frequency of disabilities.
Consumers think their chances of becoming disabled are about one in 100; a large percentage of advisors estimate those chances as one in 10 to 25. But the actual odds are as high as one in four. - Both consumers and advisors underestimate how many disabilities are caused by illnesses.
Many consumers and advisors think injuries trigger most disabilities…but the facts show that illnesses, such as back problems, cancer and heart conditions, are 10 times more likely to be the causes. - Consumers have a more catastrophic view of disabilities; advisors recognize shorter-term disabilities are more common.
Nearly one out of three consumers expect a disability would prevent someone from ever working again – but advisors accurately predict shorter disabilities occur more often due to common causes like chronic disease, back pain and arthritis. - Consumers admit to not being very well prepared for income loss; advisors believe they’re even more poorly prepared than they think.
Consumers (65%) know they couldn’t survive more than one year, but have a poorly reasoned idea of how they would get by. Advisors (88%) recognize they’re even worse off than they think and their perceived safety nets are full of holes. - Advisors mistakenly assume mostly older consumers are interested in financial planning.
One out of every four consumers agreed planning for a loss of income was “important at any age.” And 42% even said that planning should start in their 20s!
These “divides” indicate that advisors may view consumers as less aware of the risk of disability – and the need to plan for it – than is actually the case. Economic uncertainty has raised the importance of financial security. This presents encouraging new opportunities to help consumers plan for income protection.


Charts and graphs
Research has shown that many individuals prefer to receive information graphically rather than from numbers or written text. The charts and graphs below were derived from various sources, including CDA studies. Please feel free to download and print the charts and graphs to support your needs, and help support our mission to raise awareness of the risk of disability through education and public awareness.

Infographic: The Disability Disconnect
Download our handy infographic highlighting the risk, causes and consequences of disability, and how wage earners’ perceptions differ from the reality.
Download PDF for electronic use
Download PDF for print – letter size
Download individual chart images
2. Disability Divide: Worker Research Study
- Disability can happen at anytime (JPG | PDF)
- Percent who could pay the bills with no income (JPG | PDF)
- Percent who believe disability typically lasts “X” amount of time (duration) (JPG | PDF)
- What employees value (financial resources) (JPG | PDF)
- Where would the money comes from to pay bills if disabled? (JPG| PDF)
3. CDA Annual Long Term Disability Claims Review (2014)
This section last updated June 13, 2014
- Number of employers with LTD plans (View Chart)
- Number of employees with LTD coverage (View Chart)
- Number receiving disability payments (View Chart)
- Total disability payments (View Chart)
- Number of new disability claims approved (View Chart)
- Percent of disability claims by age (View Chart)
- Average age of new claimants (View Chart)
- Percentage of new claims by gender (View Chart)
- Percentage of claims by diagnosis (View Chart)
4. Social Security Disability Insurance (SSDI) Data
This section last updated June 13, 2014
- Average monthly SSDI benefit by gender (View Chart)
- Average monthly SSDI benefit by age (View Chart)
- Percent of covered workers by age – 10 year comparison (View Chart)
- Diagnostic causes of new SSDI awards (View Chart)
- Number of SSDI applications, number approved (View Chart)
- New SSDI awards as a percentage of applications (View Chart)
- SSDI historical payment data (View Chart)
- Fifteen year SSDI trends (View Chart)


 EMPLOYERS


