


![]()
![]()
CDA 2011 Advisor Disability Awareness Study
The Disability Divide: Advisor Study
The gap between consumers' attitudes - and advisors' perceptions of those attitudes - about disabilities and their potential threat to their financial security.

Overview
The State of Disability in America
Continued economic volatility. Rising home foreclosures. Eroded retirement accounts. Stubbornly high unemployment. The struggle for financial security and independence. Personal bankruptcies. All have heightened American workers’ need for a reliable stream of income. Still, many are not protected from income loss by savings, private insurance OR government programs.
- Over 1 in 4 of today’s 20-year-olds will become disabled before they retire.1
- 8.5 million disabled U.S. wage earners were receiving Social Security Disability Insurance (SSDI) benefits at the close of September 2011.2
- 90% of new long-term disability claims are caused by illnesses rather than accidents. Fewer than 5% are work related.3
- The average long-term disability claim lasts for 31.2 months.4
- New applications for Social Security Disability Insurance benefits (SSDI) increased 27% from 2008 to 2010.5
- About 100 million workers are without private disability income insurance.6
How well do financial advisors understand the “disability mindset” of the consumers they counsel? Is there a “divide” between what consumers think – and what advisors assume they think – about disability? What insights about employee attitudes and behaviors would help advisors enhance consumers’ financial security? Those are some of the key questions the Council for Disability Awareness (CDA) set out to address in its 2011 Advisor Disability Awareness Study.
To answer these important questions, the CDA conducted an online survey with a nationwide panel of financial advisors. These questions were designed to:
- Evaluate how accurately advisors can predict consumers’ attitudes around a variety of disability-related topics.
- Determine areas where there are notable differences between what consumers and advisors believe.
- Identify opportunities advisors can explore to engage participants in more meaningful conversations about disability preparedness – and to motivate them to take the necessary steps to protect their income.
We hope the insights gleaned from this research will help financial advisors learn how to make America’s wage earners more aware of the risk a disability poses to their income – and more likely to take the steps necessary to prepare for that potential loss of income.
- 1Social Security Administration, Fact Sheet March 18, 2011.
- 2Social Security Administration, Office of Disability and Income Security Programs.
- 32011 Council for Disability Awareness Long-Term Disability Claims Study.
- 42010 GenRe Disability Fact Book.
- 5Social Security Administration, Office of Disability and Income Security Programs.
- 6Social Security Administration, Fact Sheet March 18, 2011.
Charts and graphs
Research has shown that many individuals prefer to receive information graphically rather than from numbers or written text. The charts and graphs below were derived from various sources, including CDA studies. Please feel free to download and print the charts and graphs to support your needs, and help support our mission to raise awareness of the risk of disability through education and public awareness.

Infographic: The Disability Disconnect
Download our handy infographic highlighting the risk, causes and consequences of disability, and how wage earners’ perceptions differ from the reality.
Download PDF for electronic use
Download PDF for print – letter size
Download individual chart images

2. Disability Divide: Worker Research Study

- Disability can happen at anytime (JPG | PDF)
- Percent who could pay the bills with no income (JPG | PDF)
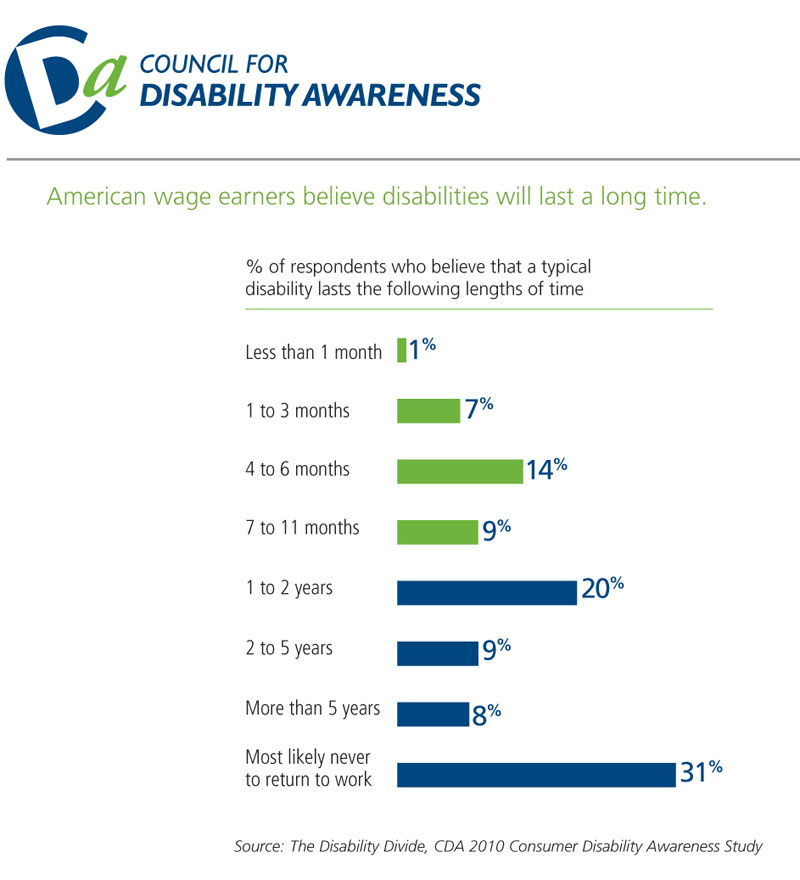
- Percent who believe disability typically lasts “X” amount of time (duration) (JPG | PDF)
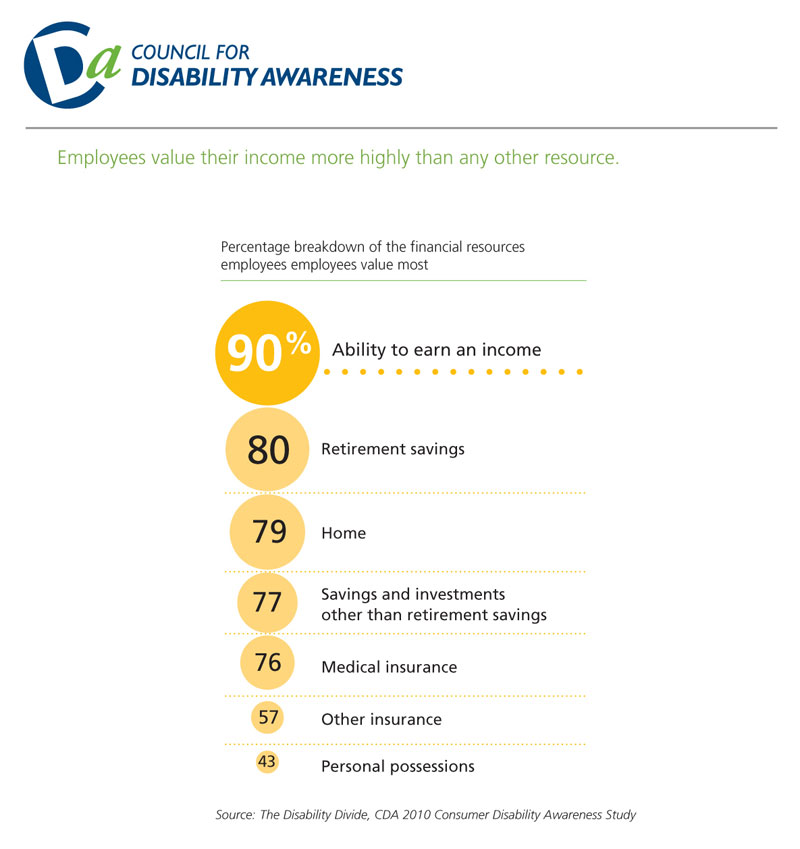
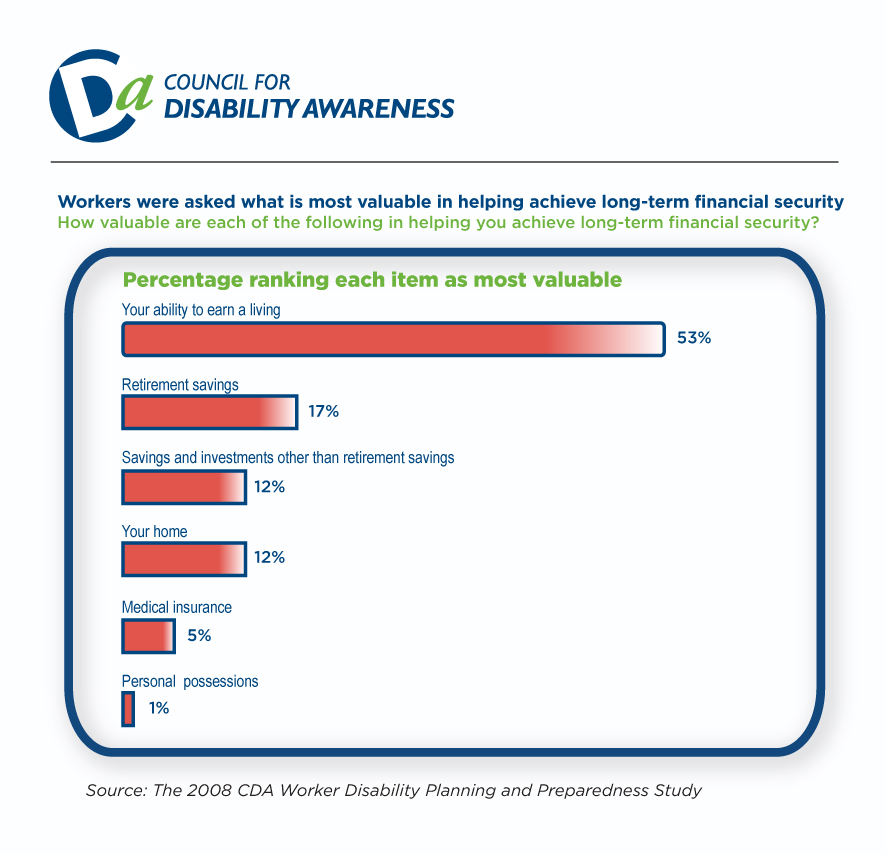
- What employees value (financial resources) (JPG | PDF)
- Where would the money comes from to pay bills if disabled? (JPG| PDF)
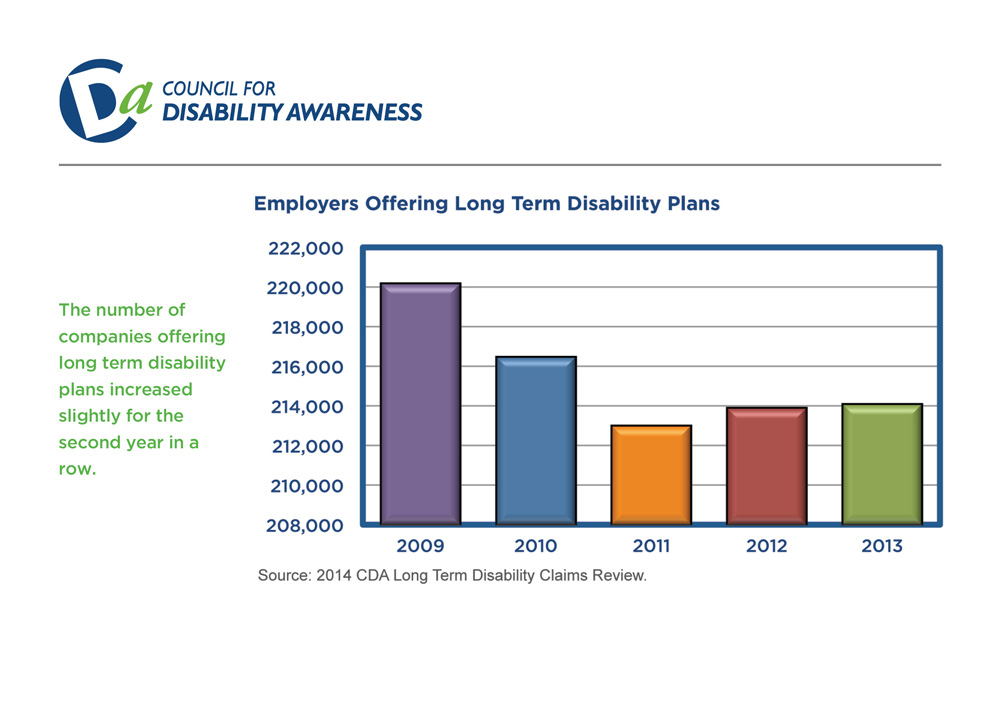
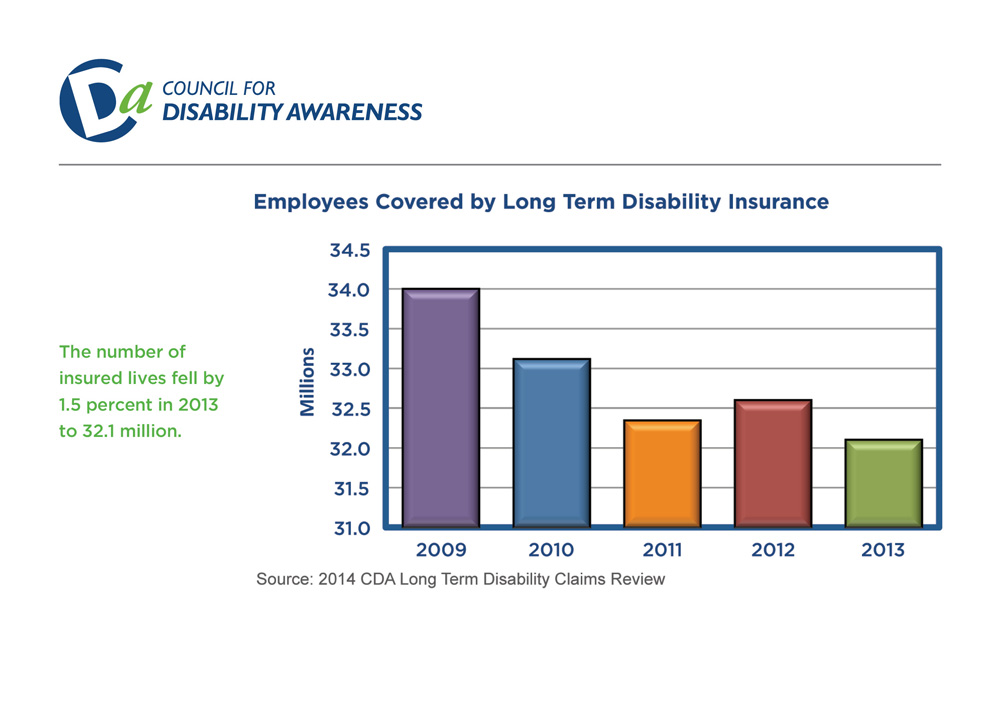
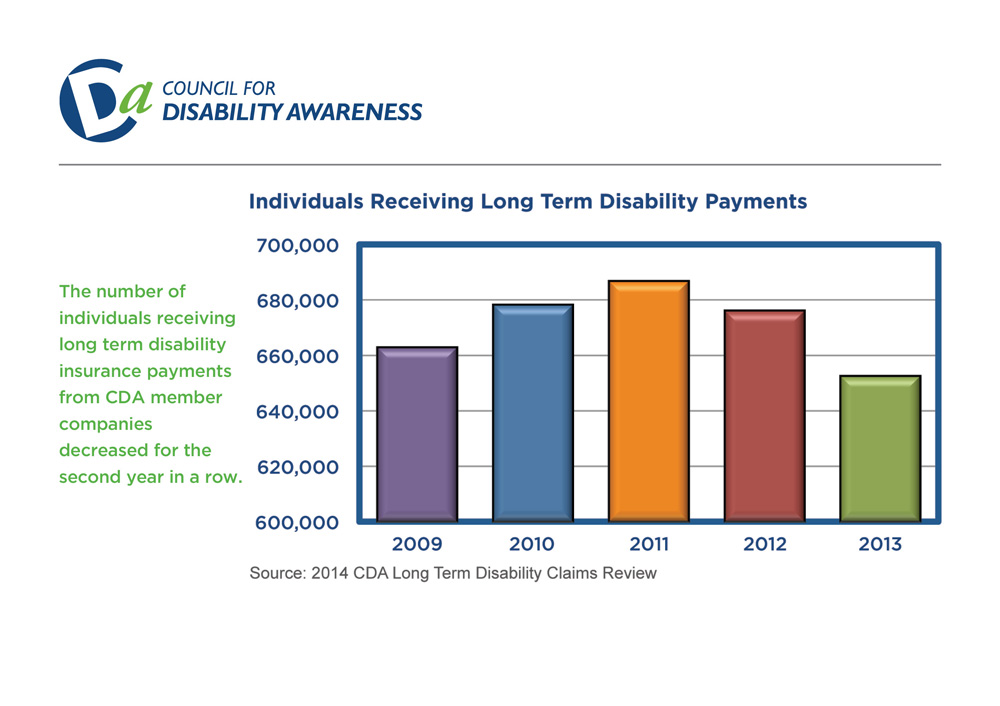
3. CDA Annual Long Term Disability Claims Review (2014)
This section last updated June 13, 2014

- Number of employers with LTD plans (View Chart)
- Number of employees with LTD coverage (View Chart)
- Number receiving disability payments (View Chart)
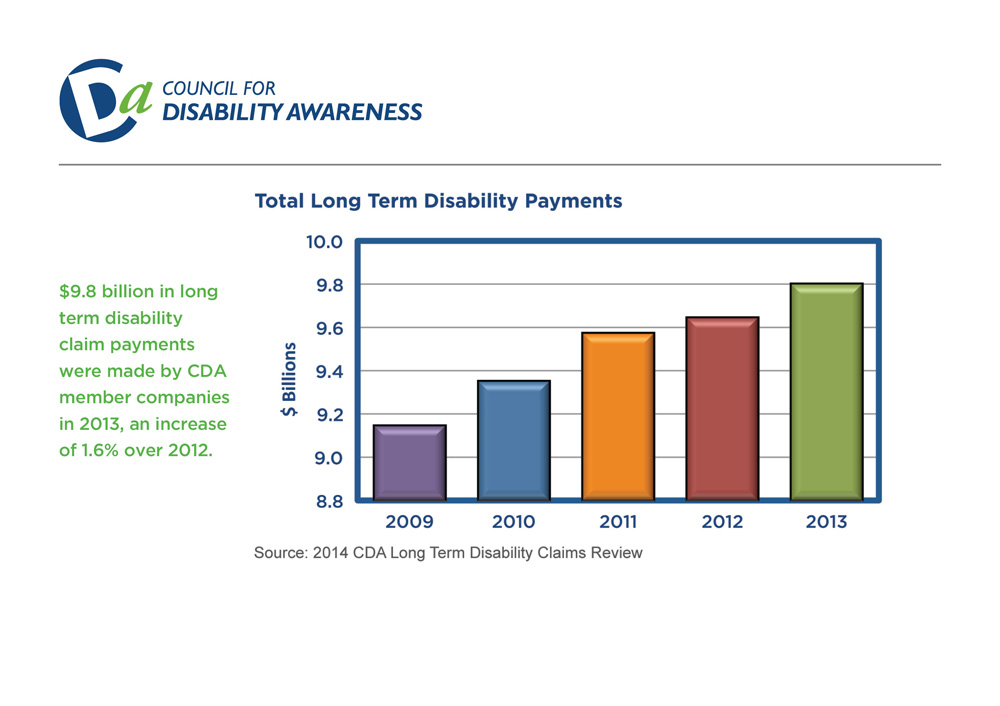
- Total disability payments (View Chart)
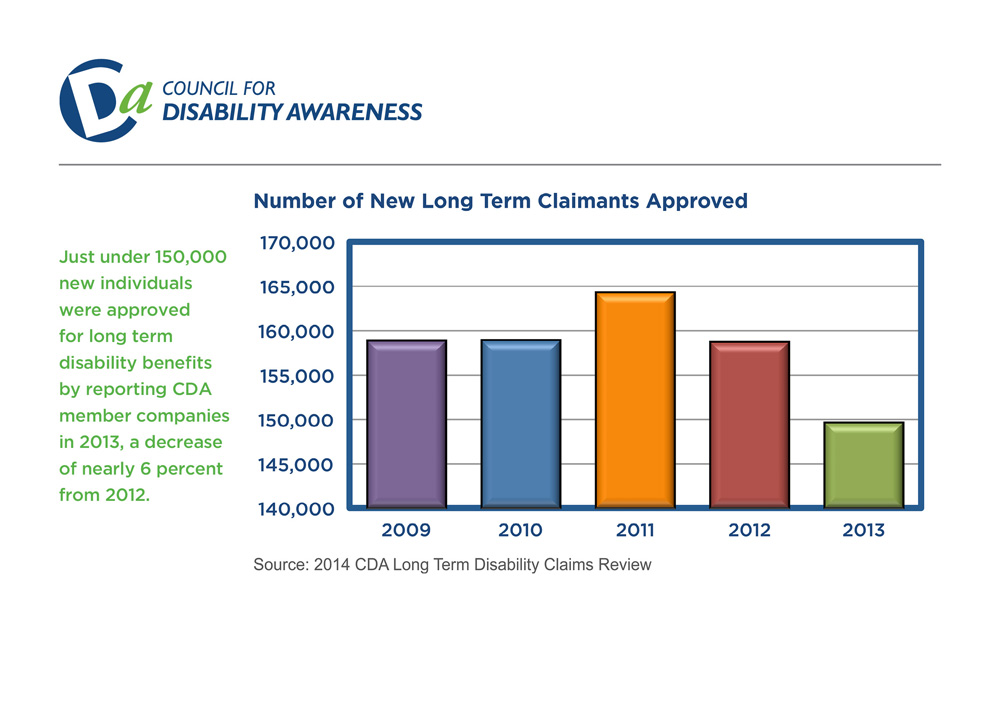
- Number of new disability claims approved (View Chart)
- Percent of disability claims by age (View Chart)
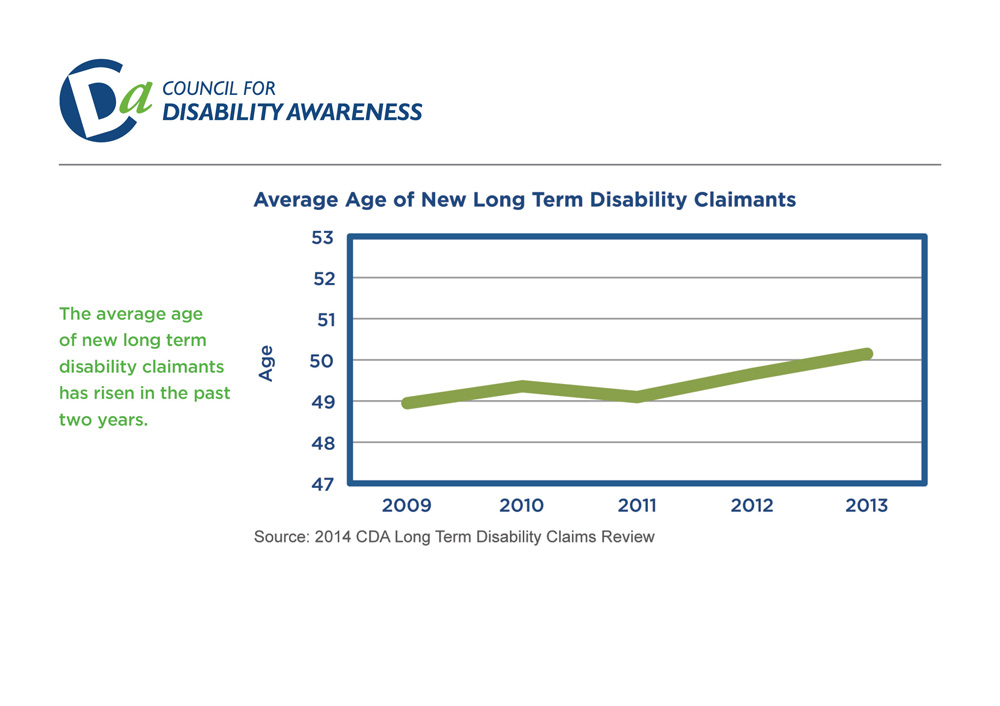
- Average age of new claimants (View Chart)
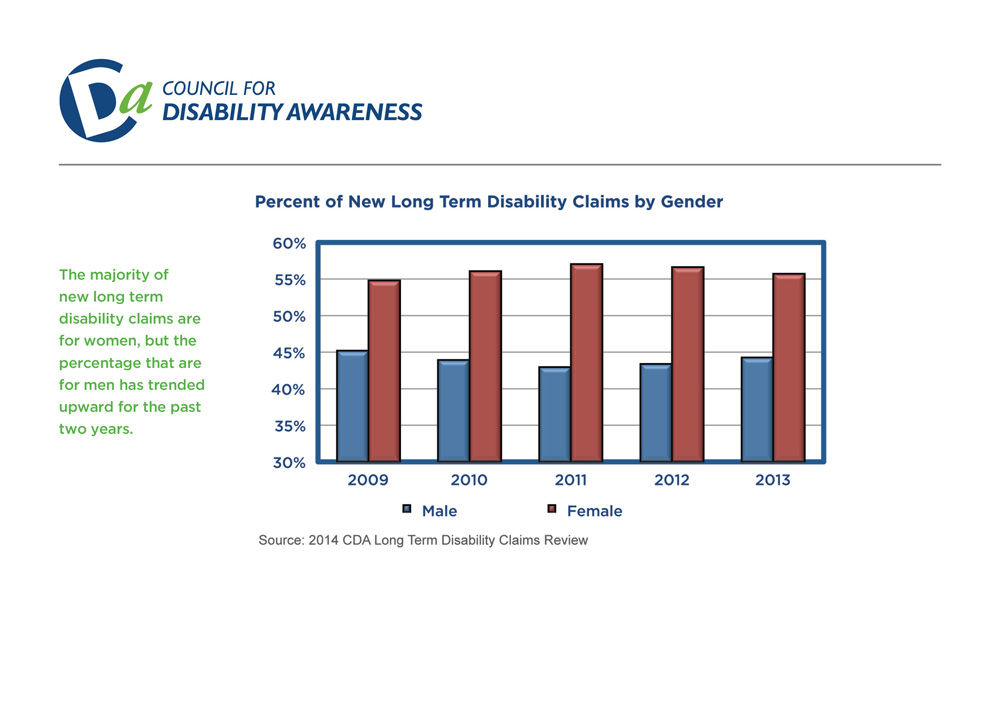
- Percentage of new claims by gender (View Chart)
- Percentage of claims by diagnosis (View Chart)
4. Social Security Disability Insurance (SSDI) Data
This section last updated June 13, 2014

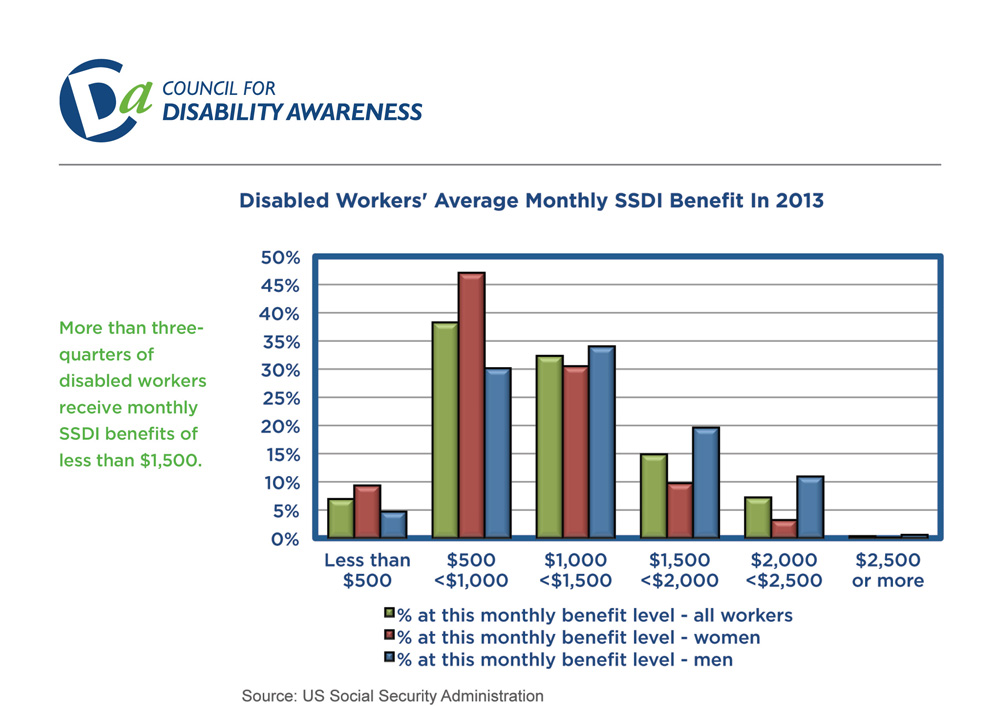
- Average monthly SSDI benefit by gender (View Chart)
- Average monthly SSDI benefit by age (View Chart)
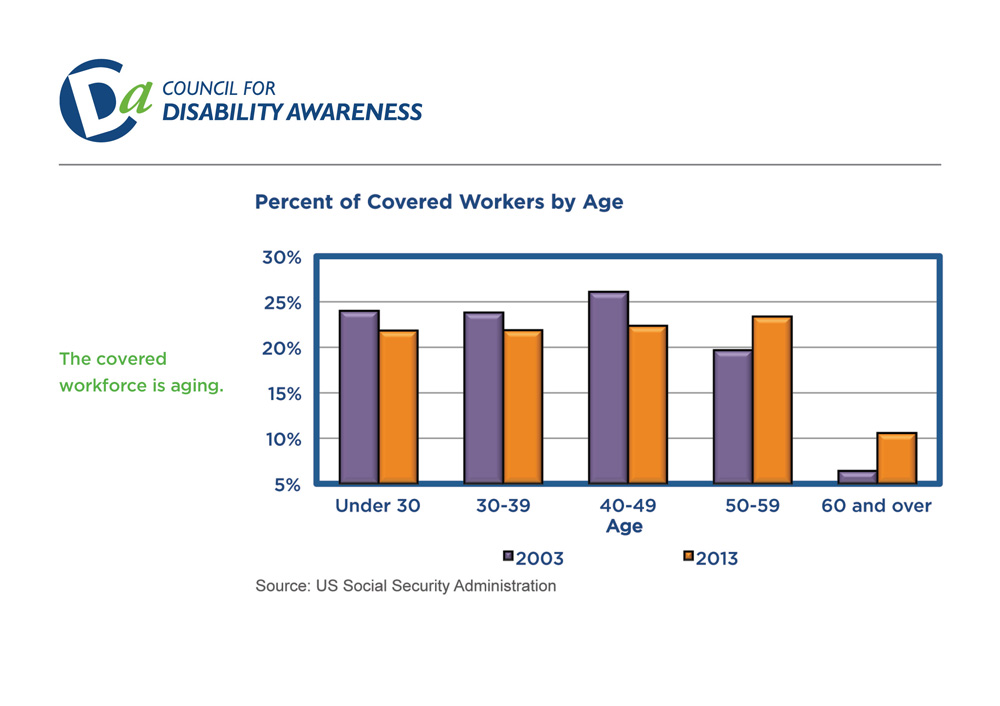
- Percent of covered workers by age – 10 year comparison (View Chart)
- Diagnostic causes of new SSDI awards (View Chart)
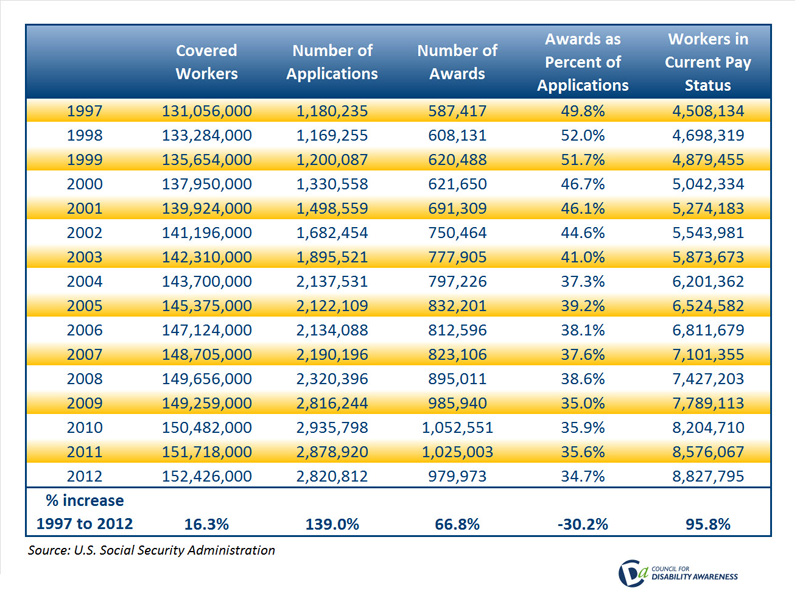
- Number of SSDI applications, number approved (View Chart)
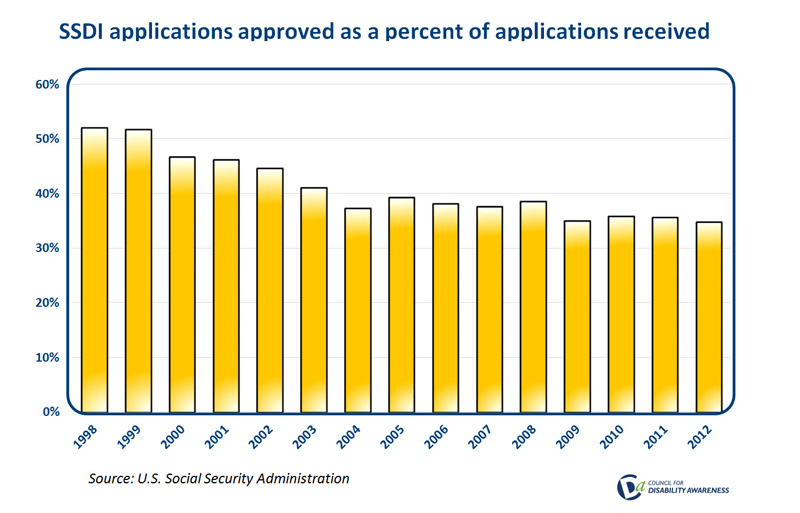
- New SSDI awards as a percentage of applications (View Chart)
- SSDI historical payment data (View Chart)
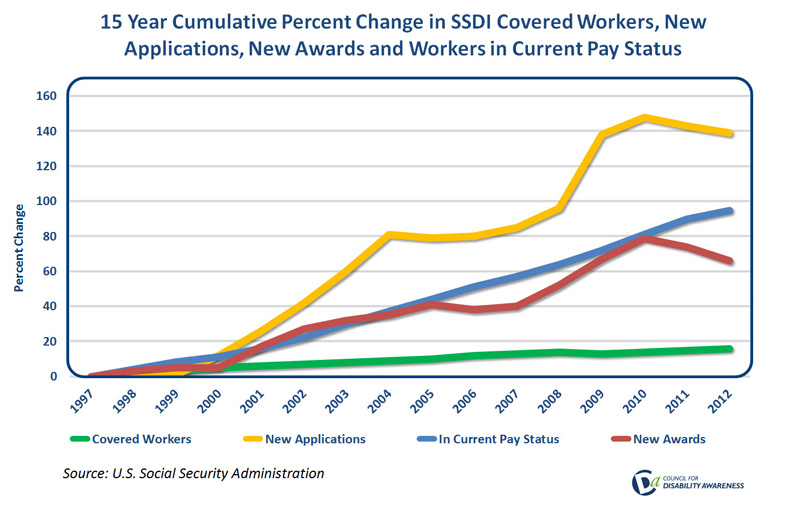
- Fifteen year SSDI trends (View Chart)