
CDA 2011 Advisor Disability Awareness Study
The Disability Divide: Advisor Study
The gap between consumers’ attitudes – and advisors’ perceptions of those attitudes – about disabilities and their potential threat to their financial security.
- Overview
- Highlights & Methodology
- Beliefs About Disability
- Overall Odds of Disability
- Causes of Disability

Causes of Disability

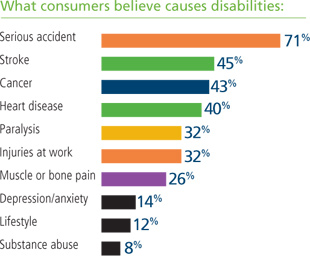
Consumers believe that accidents are the most likely cause of disabilities.
In general, consumers think disabilities are triggered by more “catastrophic” causes – like serious accidents, stroke, cancer, heart disease and paralysis. They tended to overlook more commonplace causes such as muscle or bone pain and chronic disease.

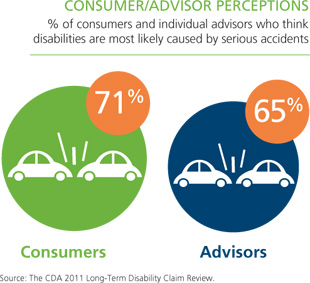
Advisors also think that injuries are the most common cause of disabilities.
Most of the advisors in the study reported that at least one of their clients had become disabled. And when asked what caused their clients’ disabilities, advisors’ reports aligned with consumers’ perceptions – but did not reflect industry statistics.
- 65% of individual advisors said their clients’ disabilities would most likely be caused by injuries and accidents.
- 94% of group advisors said disabilities were either sometimes or often caused by injuries and accidents.
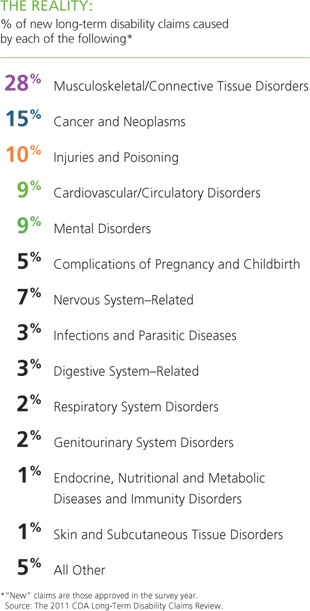
In reality, both advisors and their clients underestimate many of the leading causes of disability. As the data on the next page illustrates, musculoskeletal/connective tissue disorders such as back and neck pain and arthritis are far and away the leading causes of new long-term disability claims – followed by cancers, injuries, cardiovascular disorders and mental diseases.
Attitudinal differences by gender/income
Men and women have somewhat different views of what triggers disability. In six out of 10 categories, women rated their own chances of becoming disabled lower their male counterparts. But they think they’re more likely than men to be disabled by an accident, cancer, muscle/bone pain and depression/anxiety.
While few consumers named lifestyle and substance abuse as likely causes of disability, it’s interesting to note that both were cited more often by respondents who earn $250,000 or more per year.

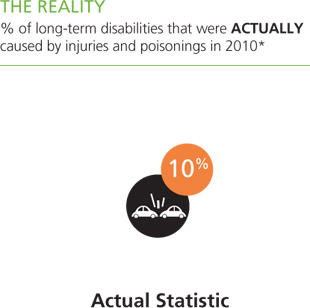
Disability insurance industry statistics reveal that only about one out of 10 long-term disabilities actually result from injury.
The CDA 2011 Long-Term Disability Claim Review reports:
- More than one out of four income-interrupting disabilities are triggered by muscle and bone disorders such as back problems, joint pain and arthritis.
- Cancer is the second leading cause of new disability claims, representing 15% of all new claims.
- Cardiovascular/circulatory problems have increased slightly and are now the fourth leading cause of new and third leading cause of existing disability claims.
- Over 95% of disabilities are not work related, and therefore not covered by workers’ compensation.
- Lifestyle choices and personal behaviors that lead to obesity are becoming major contributing factors.

Statistics show most disabilities are caused by illnesses.


Charts and graphs
Research has shown that many individuals prefer to receive information graphically rather than from numbers or written text. The charts and graphs below were derived from various sources, including CDA studies. Please feel free to download and print the charts and graphs to support your needs, and help support our mission to raise awareness of the risk of disability through education and public awareness.

Infographic: The Disability Disconnect
Download our handy infographic highlighting the risk, causes and consequences of disability, and how wage earners’ perceptions differ from the reality.
Download PDF for electronic use
Download PDF for print – letter size
Download individual chart images
2. Disability Divide: Worker Research Study
- Disability can happen at anytime (JPG | PDF)
- Percent who could pay the bills with no income (JPG | PDF)
- Percent who believe disability typically lasts “X” amount of time (duration) (JPG | PDF)
- What employees value (financial resources) (JPG | PDF)
- Where would the money comes from to pay bills if disabled? (JPG| PDF)
3. CDA Annual Long Term Disability Claims Review (2014)
This section last updated June 13, 2014
- Number of employers with LTD plans (View Chart)
- Number of employees with LTD coverage (View Chart)
- Number receiving disability payments (View Chart)
- Total disability payments (View Chart)
- Number of new disability claims approved (View Chart)
- Percent of disability claims by age (View Chart)
- Average age of new claimants (View Chart)
- Percentage of new claims by gender (View Chart)
- Percentage of claims by diagnosis (View Chart)
4. Social Security Disability Insurance (SSDI) Data
This section last updated June 13, 2014
- Average monthly SSDI benefit by gender (View Chart)
- Average monthly SSDI benefit by age (View Chart)
- Percent of covered workers by age – 10 year comparison (View Chart)
- Diagnostic causes of new SSDI awards (View Chart)
- Number of SSDI applications, number approved (View Chart)
- New SSDI awards as a percentage of applications (View Chart)
- SSDI historical payment data (View Chart)
- Fifteen year SSDI trends (View Chart)


 EMPLOYERS


