
CDA 2010 Consumer Disability Awareness Survey
The Disability Divide
The gap between what employees believe – and how they act – about the potential for an income – threatening disability
- Protection Against Disability
- Duration of Disability
- Preparation for Disability
- Income Sources in Event of Disability
- Conclusion

Income Sources in Event of Disability

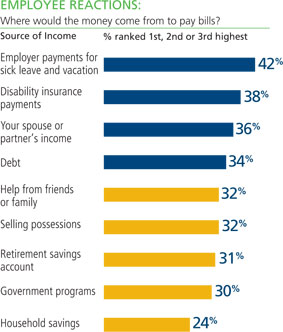
When asked what source they’d likely tap in the event they became disabled and couldn’t work, 40% of employees said they would rely on employer-funded sick/vacation leave.
Sick leave and vacation are typically short-term solutions that run out in a matter of weeks.
Other perceived top sources of income included disability insurance payments, and a spouse’s or partner’s income and debt. But most responses seemed “off the cuff” and many of the sources cited are probably not sufficient to cover living expenses.
What’s also interesting to note is that Gen Y respondents were more likely than other groups to consider tapping into their retirement savings – not likely to be a significant asset at this stage in their careers.

Other top answers employees gave also seem to reveal a lack of understanding about what income sources could actually pay the bills in the event they became disabled.
- 36% cited a partner’s income as a source of income. But if two incomes are needed to meet expenses, simply relying on just one most likely wouldn’t be enough, at least for a time. In addition, many spouses take on a caregiver role and work less when the other becomes disabled.
- 34% said they would take on more debt. But there’s little chance of qualifying for a loan when someone is disabled and unable to earn an income to pay the money back. While credit card debt was also cited as an option, it is notoriously expensive, and would be difficult to pay off because, again, there would be no income to make required payments.


Charts and graphs
Research has shown that many individuals prefer to receive information graphically rather than from numbers or written text. The charts and graphs below were derived from various sources, including CDA studies. Please feel free to download and print the charts and graphs to support your needs, and help support our mission to raise awareness of the risk of disability through education and public awareness.

Infographic: The Disability Disconnect
Download our handy infographic highlighting the risk, causes and consequences of disability, and how wage earners’ perceptions differ from the reality.
Download PDF for electronic use
Download PDF for print – letter size
Download individual chart images
1. Preparing for Disability – Protect Your Income
2. Disability Divide: Worker Research Study
- Disability can happen at anytime (JPG | PDF)
- Percent who could pay the bills with no income (JPG | PDF)
- Percent who believe disability typically lasts “X” amount of time (duration) (JPG | PDF)
- What employees value (financial resources) (JPG | PDF)
- Where would the money comes from to pay bills if disabled? (JPG| PDF)
3. CDA Annual Long Term Disability Claims Review (2014)
This section last updated June 13, 2014
- Number of employers with LTD plans (View Chart)
- Number of employees with LTD coverage (View Chart)
- Number receiving disability payments (View Chart)
- Total disability payments (View Chart)
- Number of new disability claims approved (View Chart)
- Percent of disability claims by age (View Chart)
- Average age of new claimants (View Chart)
- Percentage of new claims by gender (View Chart)
- Percentage of claims by diagnosis (View Chart)
4. Social Security Disability Insurance (SSDI) Data
This section last updated June 13, 2014
- Average monthly SSDI benefit by gender (View Chart)
- Average monthly SSDI benefit by age (View Chart)
- Percent of covered workers by age – 10 year comparison (View Chart)
- Diagnostic causes of new SSDI awards (View Chart)
- Number of SSDI applications, number approved (View Chart)
- New SSDI awards as a percentage of applications (View Chart)
- SSDI historical payment data (View Chart)
- Fifteen year SSDI trends (View Chart)


 EMPLOYERS


